| Sro | SrCO3 | SrF2 | SrSO4 | SrTiO3 | SrZrO3 | SrB4O7 | SrSi2 | BiSrCaCuO | Periodic |
.Basic XPS Information Section
(US Registered Copyright © TX-560-881)
© 2020-2026, B . Vincent Crist, All Rights Reserved
The Basic XPS Information Section provides fundamental XPS spectra, BE values, FWHM values, BE tables, overlays of key spectra, histograms and a table of XPS parameters.
The Advanced XPS Information Section is a collection of overlays of significant key spectra, peak-fitting advice, data collection guidance, material info,
common contaminants, degradation during analysis, auto-oxidation, gas capture study, valence band spectra, Auger spectra, and more.
Published literature references, and website links are summarized at the end of the advanced section.
→ Six (6) BE Tables
Strontium (Sr)
| Tausonite – SrTiO3 | Strontium Metal – Sro | Celestite – SrSO4 |
 |
 |
 |
| Page Index | |||
|
|||
- Expert Knowledge & Explanations
Peak-fits, BEs, FWHMs, and Peak Labels
| . | |||||||||||||||||||||||||||||||||||||||||||||||||||||||
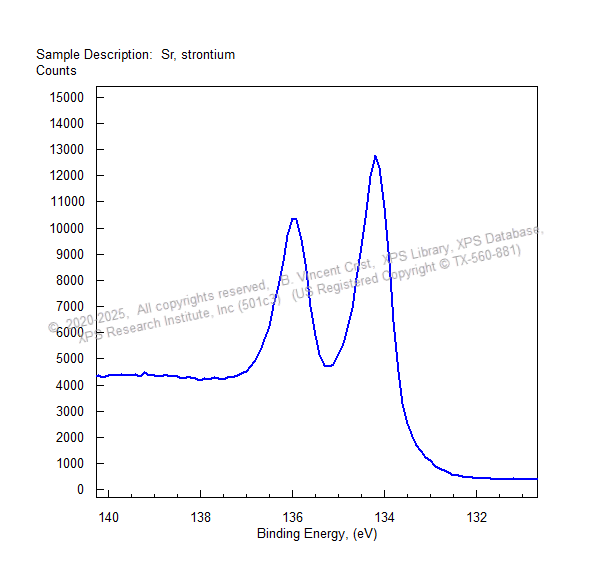
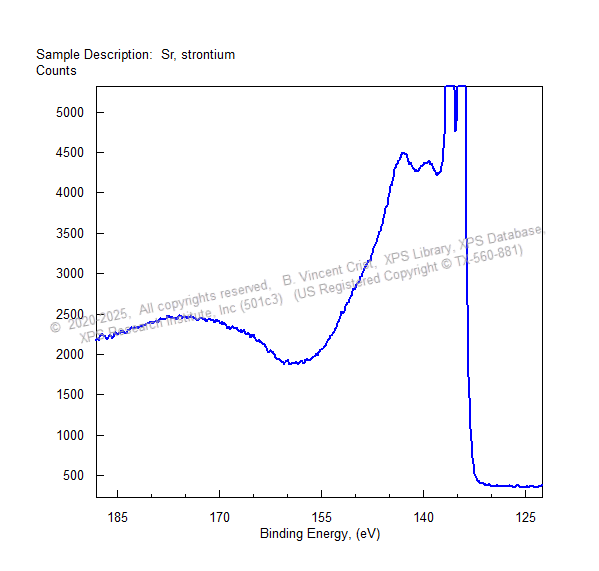
| Strontium (Sro) Metal Sr (3d) Spectrum – raw spectrum |
Strontium (Sro) Metal Peak-fit of Sr (3d) Spectrum (w/o asymm) |
||||||||||||||||||||||||||||||||||||||||||||||||||||||
 |
 |
||||||||||||||||||||||||||||||||||||||||||||||||||||||
|
|
|||||||||||||||||||||||||||||||||||||||||||||||||||||||
| → Periodic Table – HomePage | |||||||||||||||||||||||||||||||||||||||||||||||||||||||
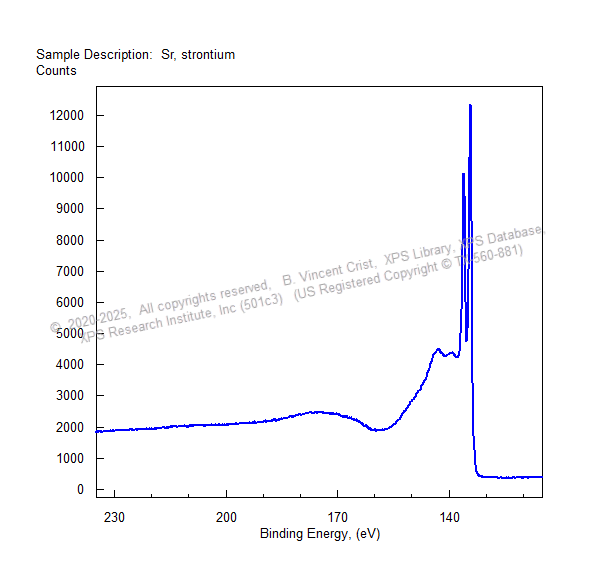
| Strontium (Sro) Metal Sr (3d) Spectrum – extended range |
Strontium (Sro) Metal Peak-fit of Sr (3d) Spectrum (w asymm) |
||||||||||||||||||||||||||||||||||||||||||||||||||||||
 |
 |
||||||||||||||||||||||||||||||||||||||||||||||||||||||
|
|
|||||||||||||||||||||||||||||||||||||||||||||||||||||||
| Survey Spectrum of Strontium (Sro) Metal with Peaks Integrated, Assigned and Labelled 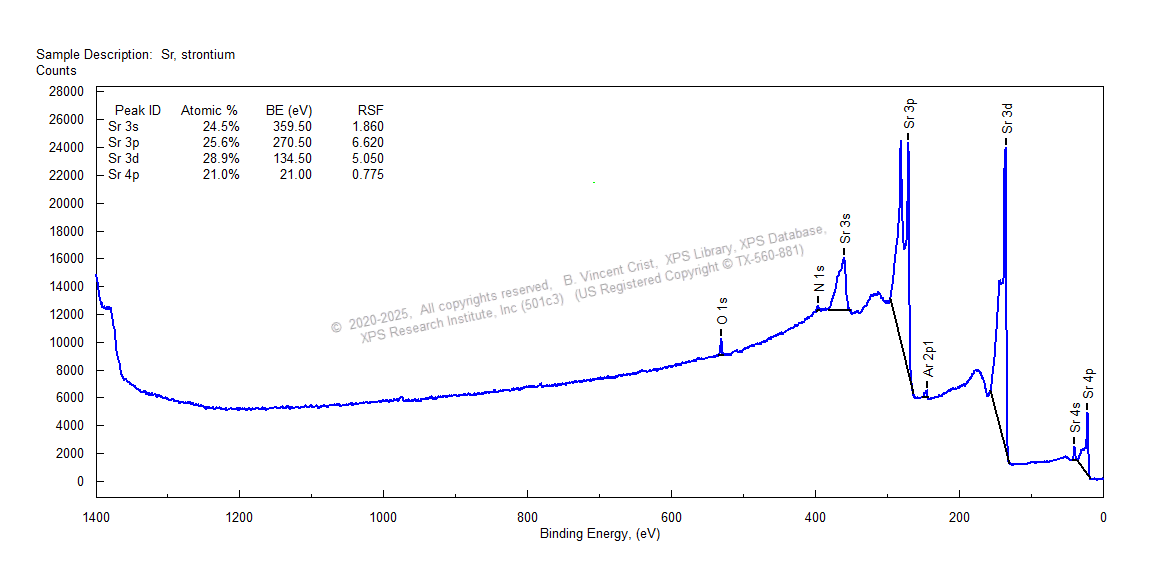 |
|||||||||||||||||||||||||||||||||||||||||||||||||||||||
 |
|||||||||||||||||||||||||||||||||||||||||||||||||||||||
|
|
|||||||||||||||||||||||||||||||||||||||||||||||||||||||
|
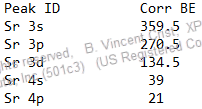
XPS Signals for Strontium, (Sro) Metal Spin-Orbit Term, BE (eV) Value, and Scofield σ for Aluminum Kα X-rays (1486 eV, 8.33 Ang)
σ: abbreviation for the term Scofield Photoionization Cross-Section which is used with IMFP and TF to produce RSFs and atom% quantitation Plasmon Peaks Energy Loss Peaks Auger Peaks Energy Loss Intrinsic Plasmon Peak: ~xx eV above peak max *Scofield Cross-Section (σ) for C (1s) = 1.0 Plasmon Peaks from Strontium, Sro Metal
Features Observed
|
|||||||||||||||||||||||||||||||||||||||||||||||||||||||
|
|
|||||||||||||||||||||||||||||||||||||||||||||||||||||||
| Side-by-Side Comparison of Strontium Sulfate and Strontium Fluoride Peak-fits, BEs, FWHMs, and Peak Labels |
|||||||||||||||||||||||||||||||||||||||||||||||||||||||
| SrSO4 | SrF2 | ||||||||||||||||||||||||||||||||||||||||||||||||||||||
Sr (3d) from SrSO4 Flood Gun ON Charge Referenced to C (1s) at 285.0 eV |
Sr (3d) from SrF2 Flood Gun ON Charge Referenced to C (1s) at 285.0 eV |
||||||||||||||||||||||||||||||||||||||||||||||||||||||
 |
 |
||||||||||||||||||||||||||||||||||||||||||||||||||||||
|
|
|
||||||||||||||||||||||||||||||||||||||||||||||||||||||
| . | |||||||||||||||||||||||||||||||||||||||||||||||||||||||
| SrSO4 | SrF2 | ||||||||||||||||||||||||||||||||||||||||||||||||||||||
| C (1s) from SrSO4 Flood Gun ON Charge Referenced to C (1s) at 285.0 eV |
C (1s) from SrF2 |
||||||||||||||||||||||||||||||||||||||||||||||||||||||
 |
 |
||||||||||||||||||||||||||||||||||||||||||||||||||||||
| → Periodic Table | |||||||||||||||||||||||||||||||||||||||||||||||||||||||
|
|
|||||||||||||||||||||||||||||||||||||||||||||||||||||||
| . | |||||||||||||||||||||||||||||||||||||||||||||||||||||||
| SrSO4 | SrF2 | ||||||||||||||||||||||||||||||||||||||||||||||||||||||
| O (1s) from SrSO4 Flood Gun ON Charge Referenced to C (1s) at 285.0 eV |
F (1s) from SrF2 |
||||||||||||||||||||||||||||||||||||||||||||||||||||||
 |
 |
||||||||||||||||||||||||||||||||||||||||||||||||||||||
|
|
|
||||||||||||||||||||||||||||||||||||||||||||||||||||||
| . | |||||||||||||||||||||||||||||||||||||||||||||||||||||||
| SrSO4 | |||||||||||||||||||||||||||||||||||||||||||||||||||||||
| S (2p) from SrSO4 Flood Gun ON Charge Referenced to C (1s) at 285.0 eV |
|||||||||||||||||||||||||||||||||||||||||||||||||||||||
 |
|||||||||||||||||||||||||||||||||||||||||||||||||||||||
| → Periodic Table |
|
||||||||||||||||||||||||||||||||||||||||||||||||||||||
|
|
|||||||||||||||||||||||||||||||||||||||||||||||||||||||

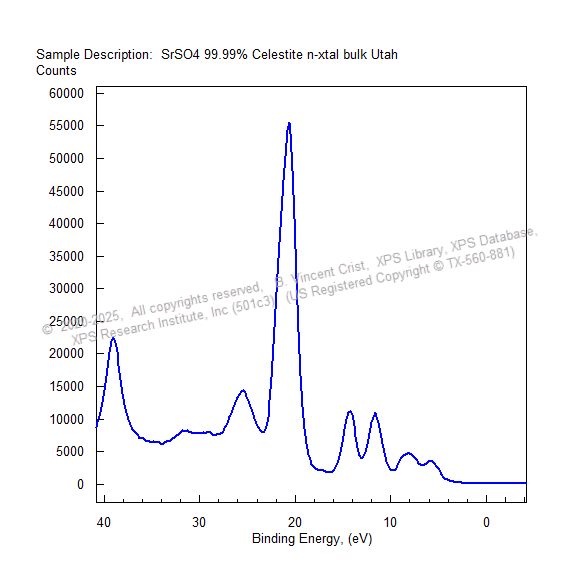
Survey Spectrum of Strontium Sulfate, SrSO4
with Peaks Integrated, Assigned and Labelled

Survey Spectrum of Strontium Fluoride, SrF2
with Peaks Integrated, Assigned and Labelled
Overlays of Sr (3d) Spectra for
Strontium (Sro) metal, SrSO4 and SrF2
| Overlay of Sro metal and SrSO4 Sr (3d) Flood Gun ON Charge Referenced to C (1s) at 285.0 eV Chemical Shift: +0.8 eV |
Overlay of Sro metal and SrF2 Sr (3d) Flood Gun ON Charge Referenced to C (1s) at 285.0 eV Chemical Shift: -0.4 eV |
 |
 |
| → Periodic Table | Copyright ©: The XPS Library |
Overlay of Sr (3d)
Sro Metal, SrSO4, & SrF2
Features Observed
- xx
- xx
- xx
Valence Band Spectra
SrSO4, SrF2
| SrSO4 Flood gun is ON, Charge referenced so C (1s) = 285.0 eV |
SrF2 Flood gun is ON, Charge referenced so C (1s) = 285.0 eV |
 |
 |
|
|
|
Overlay of Valence Band Spectra for SrSO4 and SrF2 |
|
 |
|
Features Observed
- xx
- xx
- xx
| Overlay of Sr (3d) Spectra from Strontium Carbonate (SrCO3) and Strontium Borate (SrBO3) |
|
| Strontium Carbonate, SrCO3 Peak-fit of Sr (3d) from SrCO3, powder pressed onto stage Charge Referenced to 285.0 eV |
Strontium Borate, SrBO3 Peak-fit of Sr (3d) from SrBO3, single crystal freshly cleaved Charge Referenced to 285.0 eV |
 |
 |
|
|
|
| Overlay of Sr (3d) Spectra from Sr metal, SrCO3 and SrBO3 |
|
 |
|
Features Observed
- xx
- xx
- xx
| Strontium Minerals, Gemstones, and Chemical Compounds | |||
| Goyazite – SrAl3(PO4)(PO3OH)(OH)6 | Haradaite – SrVSi2O7 | Tunellite – SrB6O9(OH)2-3H2O | Ancylite – CeSr(CO3)2(OH) · H2O |
 |
 |
 |
 |
Six (6) Chemical State Tables of Sr (3d5/2) BEs
- The XPS Library Spectra-Base
- PHI Handbook
- Thermo-Scientific Website
- XPSfitting Website
- Techdb Website
- NIST Website
Notes of Caution when using Published BEs and BE Tables from Insulators and Conductors:
- Accuracy of Published BEs
- The accuracy depends on the calibration BEs used to calibrate the energy scale of the instrument. Cu (2p3/2) BE can vary from 932.2 to 932.8 eV for old publications
- Different authors use different BEs for the C (1s) BE of the hydrocarbons found in adventitious carbon that appears on all materials and samples. From 284.2 to 285.3 eV
- The accuracy depends on when the authors last checked or adjusted their energy scale to produce the expected calibration BEs
- Worldwide Differences in Energy Scale Calibrations
- For various reasons authors still use older energy scale calibrations
- Some authors still adjust their energy scale so Cu (2p3/2) appears at 932.2 eV or 932.8 eV because this is what the maker taught them
- This range causes BEs in the higher BE end to be larger than expected
- This variation increases significantly above 600 eV BE
- Charge Compensation
- Samples that behave as true insulators normally require the use of a charge neutralizer (electron flood gun with or without Ar+ ions) so that the measured chemical state spectra can be produced without peak-shape distortions or sloping tails on the low BE side of the peak envelop.
- Floating all samples (conductive, semi-conductive, and non-conductive) and always using the electron flood gun is considered to produce more reliable BEs and is recommended.
- Charge Referencing Methods for Insulators
- Charge referencing is a common method, but it can produce results that are less reliable.
- When an electron flood gun is used, the BE scale will usually shift to lower BE values by 0.01 to 5.0 eV depending on your voltage setting. Normally, to correct for this flood gun induced shift, the BE of the hydrocarbon C (1s) peak maximum from adventitious carbon is used to correct for the charge induced shift.
- The hydrocarbon peak is normally the largest peak at the lowest BE.
- Depending on your preference or training, the C (1s) BE assigned to this hydrocarbon peak varies from 284.8 to 285.0 eV. Other BEs can be as low as 284.2 eV or as high as 285.3 eV
- Native oxides that still show the pure metal can suffer differential charging that causes the C (1s) and the O (1s) and the Metal Oxide BE to be larger
- When using the electron flood gun, the instrument operator should adjust the voltage and the XY position of the electron flood gun to produce peaks from a strong XPS signal (eg O (1s) or C (1s) having the most narrow FWHM and the lowest experimentally measured BE.
Table #1
Sr (3d5/2) Chemical State BEs from: “The XPS Library Spectra-Base”
C (1s) BE = 285.0 eV for TXL BEs
and C (1s) BE = 284.8 eV for NIST BEs
| Element | Atomic # | Compound | As-Measured by TXL or NIST Average BE | Largest BE | Hydrocarbon C (1s) BE | Source |
| Sr | 38 | BiSrCaCuOx | 132.2 eV | 285.0 eV | The XPS Library | |
| Sr | 38 | Sr-TiO3 (N*1) | 132.7 eV | 284.8 eV | Avg BE – NIST | |
| Sr | 38 | SrTiO3 | 132.7 eV | 285.0 eV | The XPS Library | |
| Sr | 38 | Sr-(OH)2 (N*1) | 133.0 eV | 284.8 eV | Avg BE – NIST | |
| Sr | 38 | Sr-CO3 | 132.9 eV | 285.0 eV | The XPS Library | |
| Sr | 38 | Sr-F2 (N*2) | 133.7 eV | 134.0 eV | 284.8 eV | Avg BE – NIST |
| Sr | 38 | Sr-BO3 | 133.8 eV | 285.0 eV | The XPS Library | |
| Sr | 38 | Sr-F2 | 133.9 eV | 285.0 eV | The XPS Library | |
| Sr | 38 | Sr-SO4 (N*2) | 134.0 eV | 134.3 eV | 284.8 eV | Avg BE – NIST |
| Sr | 38 | Sr(NO3)2 (N*1) | 134.2 eV | 284.8 eV | Avg BE – NIST | |
| Sr | 38 | Sr – element | 134.3 eV | 285.0 eV | The XPS Library | |
| Sr | 38 | Sr-SO4 | 134.9 eV | 285.0 eV | The XPS Library | |
| Sr | 38 | Sr-I2 (N*1) | 135 eV | 284.8 eV | Avg BE – NIST | |
| Sr | 38 | Sr-O (N*1) | 135.3 eV | 284.8 eV | Avg BE – NIST |
Charge Referencing Notes
- (N*number) identifies the number of NIST BEs that were averaged to produce the BE in the middle column.
- The XPS Library uses Binding Energy Scale Calibration with Cu (2p3/2) BE = 932.62 eV and Au (3d7/2) BE = 83.98 eV. BE (eV) Uncertainty Range: +/- 0.2 eV
- Charge Referencing of insulators is defined such that the Adventitious Hydrocarbon C (1s) BE (eV) = 285.0 eV. NIST uses C (1s) BE = 284.8 eV
- Note: Ion etching removes adventitious carbon, implants Ar (+), changes conductivity of surface, and degrades chemistry of various chemical states.
- Note: Ion Etching changes BE of C (1s) hydrocarbon peak.
- TXL – abbreviation for: “The XPS Library” (https://xpslibrary.com). NIST: National Institute for Science and Technology (in USA)
Table #2
Sr (3d5/2) Chemical State BEs from: “PHI Handbook”
C (1s) BE = 284.8 eV
Copyright ©: Ulvac-PHI
Table #3
Sr (3d5/2) Chemical State BEs from: “Thermo-Scientific” Website
C (1s) BE = 284.8 eV
| Chemical state | Binding energy (eV), Sr (3d5/2) |
|---|---|
| SrO | 132.9 |
| SrCO3 | 133.4 |
| SrTiO3 | 133.1 |
Copyright ©: Thermo Scientific
Table #4
Sr (3d5/2) Chemical State BEs from: “XPSfitting” Website
Chemical State BE Table derived by Averaging BEs in the NIST XPS database of BEs
C (1s) BE = 284.8 eV

Copyright ©: Mark Beisinger
Table #5
Sr (3d5/2) Chemical State BEs from: “Techdb.podzone.net” Website
XPS Spectra – Chemical Shift | Binding Energy
C (1s) BE = 284.6 eV
XPS(X線光電子分光法)スペクトル 化学状態 化学シフト ケミカルシフト
| Element | Level | Compound | B.E.(eV) | min | max | ||
| Sr | 3d5/2 | SrRh2O4 | 133.0 | ±0.3 | 132.7 | ~ | 133.3 |
| Sr | 3d5/2 | SrCO3 | 133.3 | ±0.2 | 133.1 | ~ | 133.5 |
| Sr | 3d5/2 | SrMoO4 | 133.5 | ±0.2 | 133.3 | ~ | 133.7 |
| Sr | 3d5/2 | SrF2 | 133.8 | ±0.3 | 133.5 | ~ | 134.0 |
| Sr | 3d5/2 | SrSO4 | 134.4 | ±0.3 | 134.1 | ~ | 134.6 |
| Sr | 3d5/2 | Sr | 134.5 | ±0.3 | 134.2 | ~ | 134.7 |
| Sr | 3d5/2 | Sr(NO3)2 | 134.8 | ±0.3 | 134.5 | ~ | 135.0 |
| Sr | 3d5/2 | SrO | 135.4 | ±0.3 | 135.1 | ~ | 135.6 |
Histograms of NIST BEs for Sr (3d5/2) BEs
Important Note: NIST Database defines Adventitious Hydrocarbon C (1s) BE = 284.8 eV for all insulators.
| Histogram indicates: 134.3 eV for Sro based on 2 literature BEs | Histogram indicates: 134.1 eV for SrO based on 2 literature BEs |
|
|
|


Table #6
NIST Database of Sr (3d5/2) Binding Energies
NIST Standard Reference Database 20, Version 4.1
Data compiled and evaluated
by
Alexander V. Naumkin, Anna Kraut-Vass, Stephen W. Gaarenstroom, and Cedric J. Powell
©2012 copyright by the U.S. Secretary of Commerce on behalf of the United States of America. All rights reserved.
Important Note: NIST Database defines Adventitious Hydrocarbon C (1s) BE = 284.8 eV for all insulators.
| Element | Spectral Line | Formula | Energy (eV) | Reference |
|---|---|---|---|---|
| Sr | 3d5/2 | Bi2Sr2Ca2Cu3Ox | 131.10 | Click |
| Sr | 3d5/2 | SrFeO3 | 131.40 | Click |
| Sr | 3d5/2 | Bi1.99Sr2.00Ca2Cu3Ox | 131.40 | Click |
| Sr | 3d5/2 | Bi2.00Sr2.00Ca2Cu3Ox | 131.40 | Click |
| Sr | 3d5/2 | Bi2.01Sr2.00Ca2Cu3Ox | 131.40 | Click |
| Sr | 3d5/2 | Bi2.01Sr2.00Ca2Cu3Ox | 131.40 | Click |
| Sr | 3d5/2 | Bi2.01Sr2Ca2Cu3Ox | 131.40 | Click |
| Sr | 3d5/2 | Bi1.6Pb0.4Sr2Ca2Cu3Ox | 131.40 | Click |
| Sr | 3d5/2 | Bi2Sr2CaCu2O8+x | 131.60 | Click |
| Sr | 3d5/2 | Bi1.7Pb0.4Sr2Ca2Cu3O10+x | 131.60 | Click |
| Sr | 3d5/2 | Bi1.55Pb0.6Sr2Ca2Cu3.5O10+x | 131.60 | Click |
| Sr | 3d5/2 | BiPbSr2CaCu2O8+x | 131.60 | Click |
| Sr | 3d5/2 | Bi2Sr2CaCu2O8 | 131.70 | Click |
| Sr | 3d5/2 | Bi2Sr1.4CaCu2Ox | 131.80 | Click |
| Sr | 3d5/2 | Bi2Ca1+xSr2-xCu2O8+y | 131.80 | Click |
| Sr | 3d5/2 | Bi2Ca1+xSr2-xCu2O8+y | 131.80 | Click |
| Sr | 3d5/2 | Bi2Sr2Ca2Cu2O8+x | 131.80 | Click |
| Sr | 3d5/2 | Bi2Sr2CaCu2O8+x | 131.80 | Click |
| Sr | 3d5/2 | Bi1.6Pb0.4Sr2CaCu2O8+x | 131.80 | Click |
| Sr | 3d5/2 | Bi2Sr2CaCu2Ox | 131.90 | Click |
| Sr | 3d5/2 | Bi2Sr2CaCu2O8+x | 131.90 | Click |
| Sr | 3d5/2 | Bi2CaSr2Cu2Ox | 132.00 | Click |
| Sr | 3d5/2 | Bi2CaSr2Ni0.2Cu1.8Ox | 132.00 | Click |
| Sr | 3d5/2 | Sr | 132.10 | Click |
| Sr | 3d5/2 | Bi2Sr2CaCu2O8+x | 132.20 | Click |
| Sr | 3d5/2 | Bi2Sr2CuO6 | 132.30 | Click |
| Sr | 3d5/2 | Bi2Sr2Ca2Cu3Ox | 132.30 | Click |
| Sr | 3d5/2 | SrO | 132.50 | Click |
| Sr | 3d5/2 | Bi2Sr2YCu2Ox | 132.50 | Click |
| Sr | 3d5/2 | Bi2Sr2CaCu2Ox | 132.50 | Click |
| Sr | 3d5/2 | SrTiO3 | 132.70 | Click |
| Sr | 3d5/2 | SrTiO3 | 132.70 | Click |
| Sr | 3d5/2 | Sr/Si | 132.70 | Click |
| Sr | 3d5/2 | Bi2Sr2Ca2Cu2O8+x | 132.70 | Click |
| Sr | 3d5/2 | Bi2Sr2CaCu2O8+x | 132.70 | Click |
| Sr | 3d5/2 | SrTiO3 | 132.70 | Click |
| Sr | 3d5/2 | SrO | 132.80 | Click |
| Sr | 3d5/2 | SrO | 132.80 | Click |
| Sr | 3d5/2 | SrCO3 | 132.90 | Click |
| Sr | 3d5/2 | SrCO3 | 132.90 | Click |
| Sr | 3d5/2 | SrCO3 | 132.90 | Click |
| Sr | 3d5/2 | SrS | 132.90 | Click |
| Sr | 3d5/2 | SrS | 132.90 | Click |
| Sr | 3d5/2 | Bi2Sr2CaCu2O8+x | 132.90 | Click |
| Sr | 3d5/2 | SrTiO3 | 132.90 | Click |
| Sr | 3d5/2 | Bi1.7Pb0.4Sr2Ca2Cu3O10+x | 132.90 | Click |
| Sr | 3d5/2 | Bi1.55Pb0.6Sr2Ca2Cu3.5O10+x | 132.90 | Click |
| Sr | 3d5/2 | BiPbSr2CaCu2O8+x | 132.90 | Click |
| Sr | 3d5/2 | SrCO3 | 132.90 | Click |
| Sr | 3d5/2 | La0.8Sr0.2MnO3 | 132.90 | Click |
| Sr | 3d5/2 | Sr2CuO2F2.6 | 132.90 | Click |
| Sr | 3d5/2 | SrRh2O4 | 133.00 | Click |
| Sr | 3d5/2 | Sr(OH)2.8H2O | 133.00 | Click |
| Sr | 3d5/2 | Sr(OH)2.8H2O | 133.00 | Click |
| Sr | 3d5/2 | Bi2Sr1.4CaCu2Ox | 133.00 | Click |
| Sr | 3d5/2 | Bi1.99Sr2.00Ca2Cu3Ox | 133.00 | Click |
| Sr | 3d5/2 | Bi2.00Sr2.00Ca2Cu3Ox | 133.00 | Click |
| Sr | 3d5/2 | Bi2.01Sr2.00Ca2Cu3Ox | 133.00 | Click |
| Sr | 3d5/2 | Bi2.01Sr2.00Ca2Cu3Ox | 133.00 | Click |
| Sr | 3d5/2 | Bi2.01Sr2Ca2Cu3Ox | 133.00 | Click |
| Sr | 3d5/2 | Bi2Sr2CaCu2Ox | 133.10 | Click |
| Sr | 3d5/2 | Bi2Ca1+xSr2-xCu2O8+y | 133.15 | Click |
| Sr | 3d | SrCO3 | 133.20 | Click |
| Sr | 3d5/2 | Sr3[Mn(OH)6]2 | 133.20 | Click |
| Sr | 3d5/2 | Bi2Sr2Ca0.2Y0.8Cu2Ox | 133.30 | Click |
| Sr | 3d5/2 | Bi2Sr2CaCu2Ox | 133.30 | Click |
| Sr | 3d5/2 | Bi2Sr2Ca0.5Y0.5Cu2Ox | 133.30 | Click |
| Sr | 3d5/2 | Bi1.6Pb0.4Sr2CaCu2O8+x | 133.30 | Click |
| Sr | 3d5/2 | Bi2Sr2CaCu2O8+x | 133.40 | Click |
| Sr | 3d5/2 | Sr2CuO3 | 133.40 | Click |
| Sr | 3d5/2 | SrCO3 | 133.50 | Click |
| Sr | 3d5/2 | SrMoO4 | 133.50 | Click |
| Sr | 3d5/2 | SrF2 | 133.75 | Click |
| Sr | 3d5/2 | SrF2 | 133.75 | Click |
| Sr | 3d5/2 | La0.972Sr0.212NiO3-x | 133.80 | Click |
| Sr | 3d5/2 | La1.067Sr0.220NiO3-x | 134.00 | Click |
| Sr | 3d5/2 | La0.8Sr0.2CrO3 | 134.00 | Click |
| Sr | 3d5/2 | La0.8Sr0.2FeO3 | 134.00 | Click |
| Sr | 3d5/2 | SrF2 | 134.00 | Click |
| Sr | 3d5/2 | SrF2 | 134.05 | Click |
| Sr | 3d5/2 | SrF2 | 134.05 | Click |
| Sr | 3d5/2 | SrSO4 | 134.05 | Click |
| Sr | 3d5/2 | SrSO4 | 134.05 | Click |
| Sr | 3d5/2 | SrF2 | 134.05 | Click |
| Sr | 3d5/2 | SrSO4 | 134.06 | Click |
| Sr | 3d5/2 | Sr(NO3)2 | 134.20 | Click |
| Sr | 3d5/2 | Sr | 134.20 | Click |
| Sr | 3d5/2 | Sr(NO3)2 | 134.20 | Click |
| Sr | 3d5/2 | Sr(NO3)2 | 134.20 | Click |
| Sr | 3d5/2 | La0.8Sr0.2CoO3 | 134.20 | Click |
| Sr | 3d | SrSO4 | 134.30 | Click |
| Sr | 3d5/2 | La0.8Sr0.2YO3 | 134.30 | Click |
| Sr | 3d5/2 | Sr | 134.40 | Click |
| Sr | 3d5/2 | Sr/Si | 134.40 | Click |
| Sr | 3d | Sr(NO3)2 | 134.70 | Click |
| Sr | 3d5/2 | SrCl2 | 134.70 | Click |
| Sr | 3d5/2 | SrCl2 | 134.70 | Click |
| Sr | 3d5/2 | SrBr2 | 134.70 | Click |
| Sr | 3d5/2 | SrBr2 | 134.70 | Click |
| Sr | 3d5/2 | La0.996Sr0.159NiO3-x | 134.70 | Click |
| Sr | 3d5/2 | SrBr2 | 134.70 | Click |
| Sr | 3d5/2 | SrCl2 | 134.70 | Click |
| Sr | 3d5/2 | SrI2 | 135.00 | Click |
| Sr | 3d5/2 | SrI2 | 135.00 | Click |
| Sr | 3d5/2 | SrI2 | 135.00 | Click |
| Sr | 3d5/2 | SrO | 135.30 | Click |
Statistical Analysis of Binding Energies in NIST XPS Database of BEs

Advanced XPS Information Section
Expert Knowledge, Spectra, Features, Guidance and Cautions
for XPS Research Studies on Strontium Materials
Expert Knowledge Explanations
Strontium Chemical Compounds
Peak-fits and Overlays of Chemical State Spectra
| Pure Strontium, Sro: Sr (3d) Cu (2p3/2) BE = 932.6 eV |
SrCO3: Sr (3d) C (1s) BE = 285.0 eV |
SrF2: Sr (3d) C (1s) BE = 285.0 eV |
|
|
|
Features Observed
- xx
- xx
- xx
Overlay of Sr (3d) Spectra shown Above
C (1s) BE = 285.0 eV

Chemical Shift between Sr and SrCO3: -0.3 eV
Chemical Shift between Sr and SrF2: -1.3 eV
Strontium Carbonate (SrCO3)
pressed powder
| Survey Spectrum from SrCO3 Flood gun is ON, C (1s) BE = 285.0 eV |
Sr (3d) Chemical State Spectrum from SrCO3 Flood gun is ON, C (1s) BE = 285.0 eV |
 |
|
|
|
|
| . | |
| O (1s) Chemical State Spectrum from SrCO3 Flood gun is ON, C (1s) BE = 285.0 eV |
C (1s) Chemical State Spectrum from SrCO3 Flood gun is ON, C (1s) BE = 285.0 eV |
 |
 |
|
|
|
| . | |
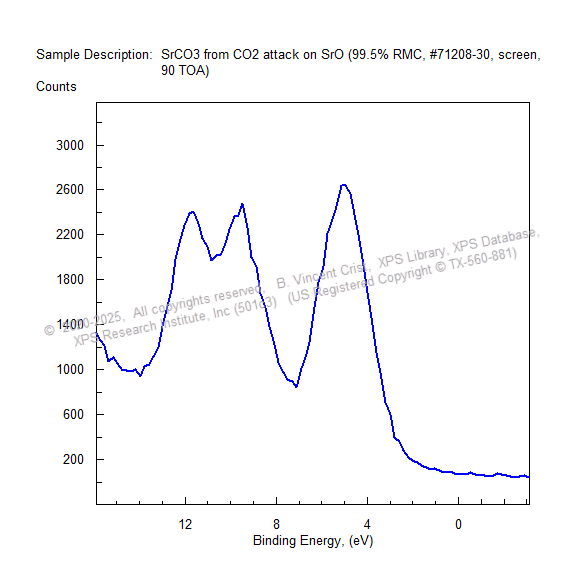
| Valence Band Spectrum from SrCO3 Flood gun is ON, C (1s) BE = 285.0 eV |
|
 |
|
|
|
|
Features Observed
- xx
- xx
- xx
Strontium Chemical Compounds
Strontium Titanate, SrTiO3
| Survey Spectrum | Sr (3d) Spectrum |
 |
 |
|
|
|
| . | |
| C (1s) Spectrum | O (1s) Spectrum |
 |
 |
|
|
|
| . | |
| Valence Band Spectrum | Ti (2p) Spectrum |
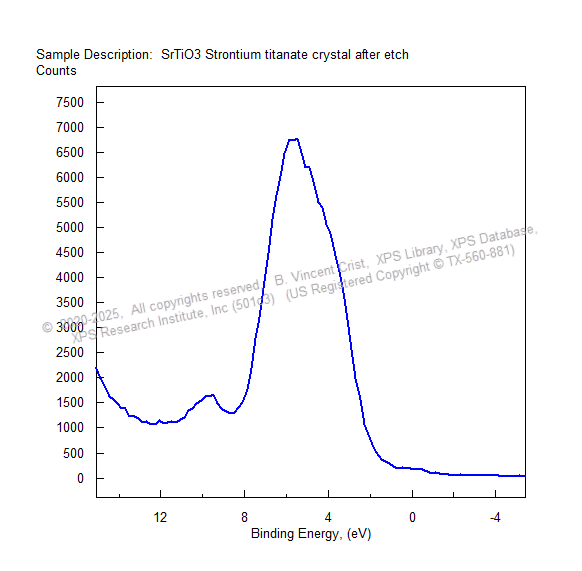 |
 |
Quantitation Details and Information
Quantitation by XPS is often incorrectly done, in many laboratories, by integrating only the main peak, ignoring the Electron Loss peak, and the satellites that appear as much as 30 eV above the main peak. By ignoring the electron loss peak and the satellites, the accuracy of the atom% quantitation is in error.
When using theoretically calculated Scofield cross-section values, the data must be corrected for the transmission function effect, use the calculated TPP-2M IMFP values, the pass energy effect on the transmission function, and the peak area used for calculation must include the electron loss peak area, shake-up peak area, multiplet-splitting peak area, and satellites that occur within 30 eV of the main peak.
Quantitation from Pure, Homogeneous Binary Compound
composed of Strontium – SrSO4
This section is focused on measuring and reporting the atom % quantitation that results by using:
- Scofield cross-sections,
- Spectra corrected to be free from Transmission Function effects
- A Pass Energy that does not saturate the detector system in the low KE range (BE = 1000-1400 eV)
- A focused beam of X-ray smaller than the field of view of the lens
- An angle between the lens and the source that is ~55 deg that negates the effects of beta-asymmetry
- TPP-2M inelastic mean free path values, and
- Either a linear background or an iterated Shirley (Sherwood-Proctor) background to define peak areas
The results show here are examples of a method being developed that is expected to improve the “accuracy” or “reliability” of the atom % values produced by XPS.
Strontium Alloys
| XxCu | XxCu |
 |
|
| → Periodic Table | |
| XxCu | XxCu |
|
|
Copyright ©: The XPS Library
XPS Facts, Guidance & Information
| Element | Strontium (Sr) |
||||
| Primary XPS peak used for Peak-fitting: | Sr (3d5/2) | ||||
| Spin-Orbit (S-O) splitting for Primary Peak: | Spin-Orbit splitting for “d” Orbital, ΔBE = 1.8 eV |
||||
| Binding Energy (BE) of Primary XPS Signal: | 134 eV |
||||
| Scofield Cross-Section (σ) Value: | Sr (3d5/2) = 2.99. Sr (3d3/2) = 2.06 |
||||
| Conductivity: | Sr resistivity = Native Oxide suffers Differential Charing |
||||
| Range of Sr (3d5/2) Chemical State BEs: | 132-136 eV range (Sro to SrF2) | ||||
| Signals from other elements that overlap Sr (3d5/2) Primary Peak: |
P (2p) | ||||
| Bulk Plasmons: | ~xx eV above peak max for pure | ||||
| Shake-up Peaks: | xx | ||||
| Multiplet Splitting Peaks: | xx | ||||
|
|
|
General Information about XXX Compounds: |
xx | ||
| Cautions – Chemical Poison Warning |
xx |
Copyright ©: The XPS Library
Information Useful for Peak-fitting Sr (3d5/2)
- FWHM (eV) of Sr (3d5/2) for Pure Sro : ~0.8 eV using 25 eV Pass Energy after ion etching:
- FWHM (eV) of Sr (3d5/2) for SrCO3: ~1.5 eV using 50 eV Pass Energy (before ion etching)
- Binding Energy (BE) of Primary Signal used for Measuring Chemical State Spectra: 134.3 eV for Sr (3d5/2) with +/- 0.2 uncertainty
- List of XPS Peaks that can Overlap Peak-fit results for Sr (3d5/2): P (2p)
General Guidelines for Peak-fitting XPS Signals
- Typical Energy Resolution for Pass Energy (PE) setting used to measure Chemical State Spectra on Various XPS Instruments
- Ag (3d5/2) FWHM (eV) = ~0.90 eV for PE 50 on Thermo K-Alpha
- Ag (3d5/2) FWHM (eV) = ~1.00 eV for PE 80 on Kratos Nova
- Ag (3d5/2) FWHM (eV) = ~0.95 eV for PE 45 on PHI VersaProbe
- Ag (3d5/2) FWHM (eV) = ~0.85 eV for PE 50 on SSI S-Probe
- FWHM (eV) of Pure Elements: Ranges from 0.4 to 1.0 eV across the periodic table
- FWHM of Chemical State Peaks in any Chemical Compound: Ranges from 1.1 to 1.6 eV (in rare cases FWHM can be 1.8 to 2.0 eV)
- FWHM of Pure Element versus FWHM of Oxide: Pure element FWHM << Oxide FWHM (e.g. 0.8 vs 1.5 eV, roughly 2x)
- If FWHM Greater than 1.6 eV: When a peak FWHM is larger than 1.6 eV, it is best to add another peak to the peak-fit envelop.
- BE (eV) Difference in Chemical States: The difference in chemical state BEs is typically 1.0-1.3 eV apart. In rare cases, <0.8 eV.
- Number of Peaks to Use: Use minimum. Do not use peaks with FWHM < 1.0 eV unless it is a or a conductive compound.
- Typical Peak-Shape: 80% G: 20% L, or Voigt : 1.4 eV Gaussian and 0.5 eV Lorentzian
- Spin-Orbit Splitting of Two Peaks (due to Coupling): The ratio of the two (2) peak areas must be constrained.
- Constraints used on Peak-fitting: typically constrain the peak area ratios based on the Scofield cross-section values
- Asymmetry for Conductive materials: 20-30% with increased Lorentzian %
- Peak-fitting “2s” or “3s” Peaks: Often need to use 50-60% Lorentzian peak-shape
Notes:
- Other Oxidation States can appear as small peaks when peak-fitting
- Pure element signals normally have asymmetric tails that should be included in the peak-fit.
- Gaseous state materials often display asymmetric tails due to vibrational broadening.
- Peak-fits of C (1s) in polymers include an asymmetric tail when the energy resolution is very high.
- Binding energy shifts of some compounds are negative due to unusual electron polarization.
Contaminants Specific to Strontium
- Strontium develops a thick native oxide due to the reactive nature of clean Strontium .
- The native oxide of Sr Ox is 8-9 nm thick.
- Strontium thin films often have a low level of iron (Fe) in the bulk as a contaminant or to strengthen the thin film
- Strontium forms a low level of Carbide when the surface is ion etched inside the analysis chamber
Commonplace Contaminants
- Carbon and Oxygen are common contaminants that appear on nearly all surfaces. The amount of Carbon usually depends on handling.
- Carbon is usually the major contaminant. The amount of carbon ranges from 5-50 atom%.
- Carbon contamination is attributed to air-borne organic gases that become trapped by the surface, oils transferred to the surface from packaging containers, static electricity, or handling of the product in the production environment.
- Carbon contamination is normally a mixture of different chemical states of carbon (hydrocarbon, alcohol or ether, and ester or acid).
- Hydrocarbon is the dominant form of carbon contamination. It is normally 2-4x larger than the other chemical states of carbon.
- Carbonate peaks, if they appear, normally appear ~4.5 eV above the hydrocarbon C (1s) peak max BE.
- Low levels of carbonate is common on many s that readily oxidize in the air.
- High levels of carbonate appear on reactive oxides and various hydroxides. This is due to reaction between the oxide and CO2 in the air.
- Hydroxide contamination peak is due to the reaction with residual water in the lab air or the vacuum.
- The O (1s) BE of the hydroxide (water) contamination normally appears 0.5 to 1.0 eV above the oxide peak
- Sodium (Na), Potassium (K), Sulfur (S) and Chlorine (Cl) are common trace to low level contaminants
- To find low level contaminants it is very useful to vertically expand the 0-600 eV region of the survey spectrum by 5-10X
- A tiny peak that has 3 or more adjacent data-points above the average noise of the background is considerate to be a real peak
- Carbides can appear after ion etching various reactive s. Carbides form due to the residual CO and CH4 in the vacuum.
- Ion etching can produce low oxidation states of the material being analyzed. These are newly formed contaminants.
- Ion etching polymers by using standard Ar+ ion guns will destroy the polymer, converting it into a graphitic type of carbon
Data Collection Guidance
- Chemical state differentiation can be difficult
- Collect principal Sr (3d) peak
- Long time exposures (high dose) to X-rays can degrade various polymers, catalysts, high oxidation state compounds
- During XPS analysis, water or solvents can be lost due to high vacuum or irradiation with X-rays or Electron flood gun
- Auger signals can sometimes be used to discern chemical state shifts when XPS shifts are very small
Data Collection Settings for Strontium (Sr)
- Conductivity: Strontium readily develops a native oxide that is sensitive to Flood Gun – Differential Charging Possible – float sample recommended
- Primary Peak (XPS Signal) used to measure Chemical State Spectra: Sr (3d5/2) at 134eV
- Recommended Pass Energy for Measuring Chemical State Spectrum: 40-50 eV (Produces Ag (3d5/2) FWHM ~0.7 eV)
- Recommended # of Scans for Measuring Chemical State Spectrum: 4-5 scans normally (Use 10-25 scans to improve S/N)
- Dwell Time: 50 msec/point
- Step Size: 0.1 eV/point (0.1 eV/step or 0.1 eV/channel)
- Standard BE Range for Measuring Chemical State Spectrum: 125 – 145 eV
- Recommended Extended BE Range for Measuring Chemical State Spectrum: 120 – 220 eV
- Recommended BE Range for Survey Spectrum: -10 to 1,100 eV (above 1,100 eV there are no useful XPS signals, except for Ge, As and Ga, above 1100 is waste of time)
- Typical Time for Survey Spectrum: 3-5 minutes for newer instruments, 5-10 minutes for older instruments
- Typical Time for a single Chemical State Spectrum with high S/N: 5-10 minutes for newer instruments, 10-15 minutes for older instruments
Effects of Argon Ion Etching
- Carbides appear after ion etching Sr and various reactive surfaces. Carbides form due to the presence of residual CO and CH4 in the vacuum.
- Ion etching can produce low oxidation states of the material being analyzed. These are newly formed contaminants.
- Ion etching polymers by using standard Ar+ ion guns will destroy the polymer, converting it into a graphitic type of carbon
 |
|
|
Interpretation of XPS spectra
- Sr3d region has well resolved spin-orbit components (Δ=1.76eV, ratio=0.690).
- When multiple chemical states are present, apparent resolution of these two spin-orbit components is reduced. (Compare Sr zirconate with SrO/SrCO3 spectra below.)

End of File
[/fusion_text][/fusion_builder_column][/fusion_builder_row][/fusion_builder_container]